
Data is the most abundant resource in the modern business world, and for many organizations it is also the most underused. Companies are generating more transactional data, customer behavior data, and operational data than ever before, yet a significant portion of that information sits in disconnected systems, spreadsheets, and databases that no decision maker can easily see or act on. A business intelligence solution is the infrastructure that changes this dynamic. It collects data from across an organization, transforms it into coherent, trustworthy information, and presents it through dashboards and reports that allow leaders and teams to make faster, better-informed decisions.
In 2026, the global business intelligence market is valued at over $35 billion and continues to grow at roughly 10 percent annually according to Gartner research. Yet despite this investment, 73 percent of BI implementations fail to deliver expected return on investment within their first year. That gap between potential and outcome is almost always a function of how organizations approach the selection and implementation process rather than any inherent limitation of the technology itself.
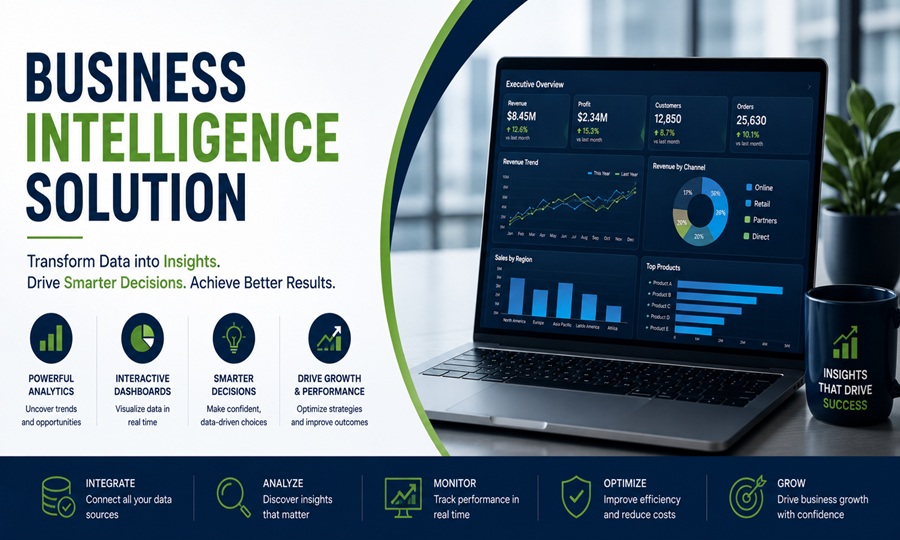
What a Business Intelligence Solution Actually Does
A business intelligence solution is a technology platform that enables organizations to collect data from multiple sources, transform and clean it into a reliable and consistent format, analyze it for patterns, trends, and anomalies, and present findings through interactive dashboards, scheduled reports, and visualizations that non-technical users can navigate independently.
The operational value of this capability is concrete. Instead of a finance team spending three days manually pulling numbers from an ERP and formatting them into a quarterly report, a BI solution does that work automatically and makes the output available in real time. Instead of a sales manager waiting until Monday morning to see last week’s pipeline performance, they can view it on their phone Saturday evening. Instead of a marketing team arguing about whose spreadsheet version is correct, everyone in the organization looks at the same governed, authoritative numbers from a single source of truth.
As Forrester’s 2024 BI Platforms Landscape report found, implementation success correlates more strongly with clarity of requirements than with vendor capabilities. This means that organizations which invest time defining what decisions they need to make, what data those decisions require, and what business outcomes they are trying to improve before selecting a platform consistently outperform those that start with the tool selection and work backward.
The Four Core Components of a BI Solution
Understanding the building blocks of a BI solution helps organizations evaluate platforms more accurately and diagnose gaps in their existing setup.
Data integration and connectivity is the foundation. A BI solution must be able to connect to every system where relevant business data lives, including ERPs, CRMs, databases, cloud storage platforms, marketing tools, and financial systems. The depth and reliability of these connections directly determines how complete and trustworthy the resulting analysis will be. Platforms that offer pre-built connectors to common enterprise systems like Salesforce, SAP, Microsoft Dynamics, and Google Analytics significantly reduce the technical effort required to get a BI deployment operational.
Data modeling and transformation is the process that turns raw, often messy data from multiple sources into a clean, consistent dataset that everyone in the organization can rely on. A semantic layer, which defines standard metrics and dimensions in business terms rather than database terminology, is what allows a non-technical marketing manager to build a report using the phrase “monthly active customers” and have it calculate correctly every time rather than producing different numbers depending on how the underlying query is written.
Visualization and reporting is the layer most people think of when they imagine BI software. Interactive dashboards, drill-down charts, geographic maps, trend lines, and KPI scorecards are the interface through which business users engage with data. The quality of the visualization layer determines whether the insights generated actually reach the people who need them or stay confined to analysts who understand the underlying system.
Self-service analytics is the capability that separates modern BI platforms from their predecessors. Traditional BI required IT teams or data specialists to build every report, creating a bottleneck that meant business users waited days or weeks for the analysis they needed. Self-service BI allows any sufficiently trained business user to explore data, build their own dashboards, and answer their own questions without technical assistance. According to Gartner’s 2025 data, 59 percent of CMOs report lacking sufficient resources for data analysis, and self-service capabilities are the primary mechanism through which BI platforms extend analytical capability across an organization without proportionally increasing headcount.
The Leading Platforms in 2026 and What Distinguishes Them
The BI market in 2026 is dominated by three platforms that together account for nearly half of all enterprise deployments, each serving a distinct organizational profile.
Microsoft Power BI holds approximately 20 percent of the global BI market by share and is the clear default choice for organizations operating within the Microsoft ecosystem. Its integration with Excel, SharePoint, Teams, and Azure is seamlessly deep, meaning adoption friction is significantly lower for organizations where employees already live in Microsoft tools. Power BI’s pricing starts at approximately $10 per user per month for Pro and $20 per user per month for Premium, and it is frequently bundled into Microsoft 365 enterprise agreements at no additional cost. Power BI’s documented case studies consistently show 40 to 60 percent cost reductions versus legacy BI tools. Microsoft’s Copilot AI integration in 2026 adds natural language report generation and automated insight surfacing, making it increasingly accessible to non-technical users.
Tableau holds approximately 16.4 percent market share and is widely recognized as the strongest pure visualization platform available. It handles datasets of 100 million rows or more without pre-aggregation and excels in scenarios where end users need to explore data in an open-ended, ad-hoc manner rather than consuming predefined reports. Tableau’s visualization flexibility and depth are unmatched among mainstream platforms. The trade-off is that many users find its interface less intuitive than Power BI for straightforward reporting tasks, and its pricing, which is available through sales rather than a public price list, tends to run higher than Power BI for comparable user counts.
Looker, now part of Google Cloud, is a cloud-native platform built around a centralized data modeling layer called LookML that enforces consistent metric definitions across every report and dashboard in the organization. This makes Looker particularly strong for large enterprises where data governance and consistency across departments is a priority. As Google Looker’s documentation on its semantic modeling approach explains, by defining all business logic in a single reusable code layer rather than duplicating it in individual reports, Looker ensures that every team in the organization is working from the same authoritative definitions of revenue, customer count, or any other critical metric. Looker Studio, the free tier of the product formerly known as Google Data Studio, is an accessible entry point for smaller organizations already using Google Analytics and Google Ads.
The AI Transformation of Business Intelligence
The integration of artificial intelligence into BI platforms is the most significant development reshaping the industry in 2025 and 2026, and its effects are visible across every major platform.
Natural language querying has moved from a novelty to a standard capability. Users can now type a question in plain English, such as “what were the top five products by revenue last quarter in the Northeast region,” and receive an instant, accurately rendered chart without writing a single line of SQL or building a query manually. This capability is particularly transformative for senior executives and frontline managers who need data quickly but do not have time to learn analytical tools in depth.
AI-powered anomaly detection continuously monitors data streams and proactively alerts users when a metric deviates significantly from expected patterns, without waiting for someone to notice the change in a scheduled report. An e-commerce business might receive an alert that conversion rates dropped 18 percent in the prior four hours, long before any scheduled daily report would surface the issue. The streaming analytics market crossed $4.34 billion in 2025, reflecting sustained enterprise investment in real-time operational intelligence.
Predictive analytics embedded directly into BI platforms allows organizations to generate revenue forecasts, customer churn predictions, and inventory demand projections without requiring a separate data science infrastructure. For organizations that previously needed a dedicated data science team to produce any forward-looking analysis, this represents a genuine democratization of capability that used to be reserved for the largest, most technically sophisticated enterprises.
Why 73 Percent of BI Implementations Underdeliver
Understanding why so many BI investments produce disappointing returns is as important as understanding the technology itself. The failure patterns are consistent and well-documented.
The most common failure is implementing a BI platform before addressing data quality. A BI solution presents data clearly and convincingly. If the underlying data is inconsistent, duplicated, or inaccurate, the BI platform makes it easier to act on bad information with greater confidence, which is worse than not having BI at all. Organizations that invest in data governance, standardization, and quality controls before or during BI deployment produce dramatically better outcomes than those that rush to the reporting layer without validating what sits beneath it.
The second failure pattern is purchasing for features rather than fit. As research consistently shows, companies waste significant resources on Tableau enterprise licenses when Power BI would have solved their problems at a fraction of the cost, or implement complex enterprise platforms when a mid-tier solution would have been faster to deploy and easier to adopt. The right BI solution is the one that addresses your actual decision-making needs at an adoption level your team can realistically sustain, not the one with the most impressive feature demonstration.
The third failure pattern is treating BI as an IT project rather than a business transformation. BI implementations that are driven by IT departments without deep involvement from the business users who will actually rely on the outputs consistently produce dashboards that nobody uses. The business users who will make decisions based on the platform need to be involved in defining requirements, shaping the data model, and validating that the outputs actually reflect the business reality they understand.
Building a BI Solution That Delivers Lasting Value
The organizations that consistently get the most from their BI investments share a common approach. They start with a focused set of high-value decisions that better data would improve. They invest in data quality and governance before building dashboards. They choose platforms that match their existing technology ecosystem and their team’s technical capacity. They involve business users in the design process and measure adoption as rigorously as they measure technical performance. And they treat the BI implementation as a starting point for a continuous data capability rather than a project with a completion date.
The value of genuine business intelligence does not come from the technology. It comes from the organizational discipline to use data consistently as a foundation for decisions that would otherwise be made on instinct, assumption, or the most persuasive voice in the room.